Analytics
Dashboard vs. Reporting System. What's the Real Difference?
Most D2C brands have a dashboard. Very few have a reporting system. The difference determines whether your data works for you or whether you work for your data.
Most D2C brands have a dashboard. Very few have a reporting system.
If you have a Shopify analytics tab open right now, or a Google Looker Studio link someone built six months ago, you have a dashboard.
That is not the same as a reporting system.
The difference sounds semantic. It isn't. It determines whether your business runs on data or just talks about data.
This post explains what separates the two, why most D2C brands are stuck at the dashboard stage, and what it actually takes to build something that works without a person holding it together.
What a Dashboard Actually Is
A dashboard is a view.
It shows you a snapshot of your data at a specific moment in time. It answers questions like: what were my sales yesterday? What is my ROAS this week? How many orders did I fulfil today?
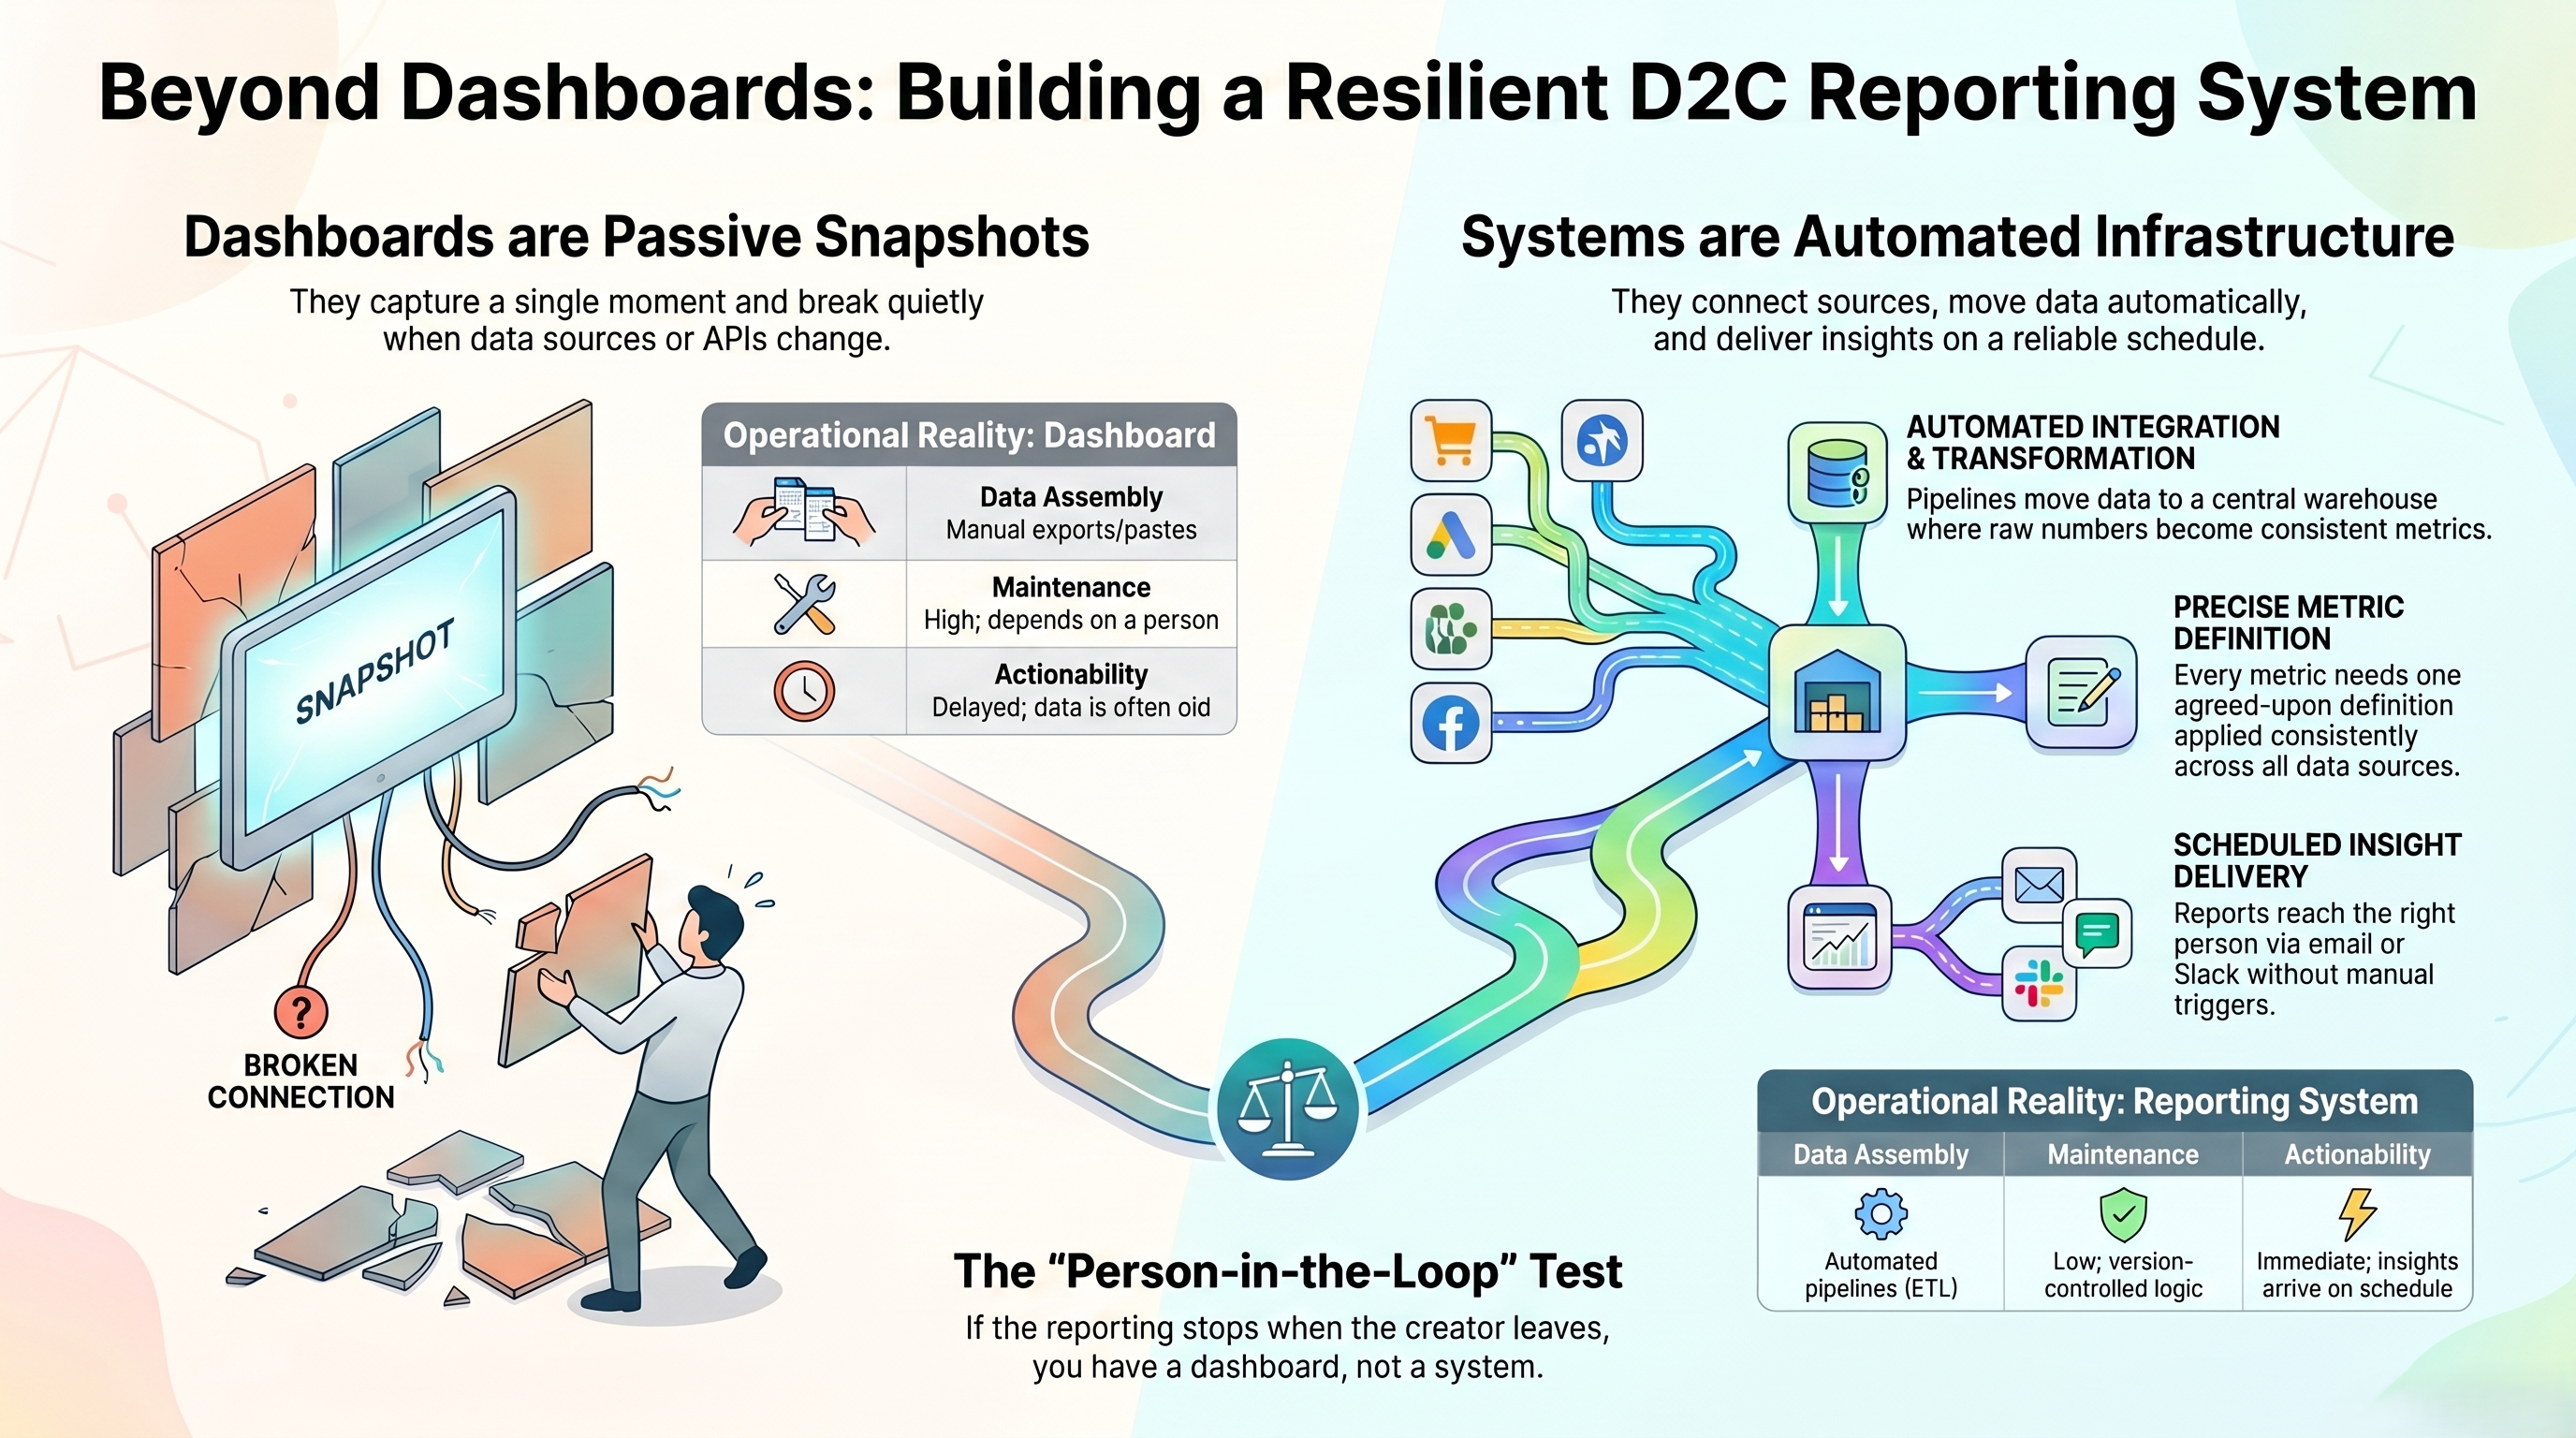
Dashboards are valuable. They give you visibility. But they have a fundamental design limitation: they are passive. They show you what you point them at. They do not connect sources on their own, clean inconsistent data, send you anything, or continue to exist when someone stops maintaining them.
Most D2C dashboards start as a quick fix to a reporting problem. A founder wants visibility into performance, a marketing manager is tired of stitching together spreadsheets, or an agency builds a dashboard to centralize key metrics. Initially, it works well. But as the business grows, new channels are added, data sources change, APIs get updated, and ownership shifts. Because the underlying process was never designed as a system, small issues begin to accumulate. Connections break, definitions become inconsistent, and trust in the numbers gradually erodes. The dashboard may still be there, but it is no longer reflecting reality accurately, and most teams only realize it when a critical decision hinges on a number they can no longer trust.
A dashboard is infrastructure the same way a printout is infrastructure. It captures a moment. It does not create a system.
What a Reporting System Actually Is
A reporting system is infrastructure.
It connects your data sources, moves data automatically, transforms raw numbers into consistent metrics, and delivers insight to the right person on a schedule, without anyone having to build it each time.
A reporting system has four layers.
Layer 1: Data Sources
Your Shopify store, Meta Ads, Google Ads, email platform, returns portal, and cost sheets. A reporting system knows where all of these live and pulls from them reliably.
Layer 2: Integration
The pipelines that move data from each source into a central location. This could be a data warehouse like BigQuery, a set of automated spreadsheet connections, or a purpose-built ETL tool. The key is that data flows automatically, not manually.
Layer 3: Transformation
Raw data from Shopify, Meta, and other tools is not the same as meaningful business metrics. Transformation is the process of combining, cleaning, and standardising that data to create consistent measures such as contribution margin, CAC, and ROAS. This is where business rules are applied, costs are allocated, returns are accounted for, and raw numbers become decision-ready insights. This is also where a reporting system creates most of its value.
Layer 4: Insight Delivery
The output layer. This could be a dashboard, a scheduled email digest, a Slack alert when ROAS drops below a threshold, or a weekly PDF report. The format matters less than the fact that it happens automatically, on a schedule, without someone manually triggering it.
The difference between a dashboard and a reporting system is not the tool. It is whether layers 1 through 3 exist and work reliably.
Why Dashboards Break and Reporting Systems Don't
Dashboards depend on a person.
Someone has to export the CSV. Someone has to update the Shopify connection when the API version changes. Someone has to remember to add the new ad account when the brand launches on a new platform. Someone has to reconcile the numbers when Shopify and Meta report different revenue figures for the same day.
When that person is busy, sick, or gone, the dashboard stops reflecting reality. The team keeps making decisions off the last reliable version, which might be three weeks old.
Reporting systems are designed to remove the person from the loop for routine data delivery. The pipelines run on a schedule. The transformation logic is documented and version-controlled. The output appears whether or not anyone remembered to trigger it.
This is not about automation for its own sake. It is about whether your business can make consistent, data-backed decisions every week without a manual effort to make that happen.
The Signs You Have a Dashboard, Not a System
You pull data manually every week.
Every Monday someone exports from Shopify, downloads the Meta report, and pastes numbers into a spreadsheet. The process takes 45 minutes to 2 hours. This is not reporting, this is data assembly.
Your numbers are always a few days old.
You are checking last week's performance on Wednesday. By the time the data is ready, the decisions are already made based on instinct or the prior week's numbers.
The founder is still the one checking performance.
If the CEO is the one opening the dashboard to verify what happened, the business has a data dependency on its most expensive and busiest person.
It takes more than 30 minutes to understand what happened last week.
A reporting system should give you a clear picture of the previous week in under 10 minutes. If your current setup takes longer, you are spending time assembling data rather than reading it.
Nobody trusts the numbers.
The clearest sign of a dashboard without infrastructure underneath: two people pull numbers for the same period and get different answers. This happens when there is no single source of truth, no transformation layer, and no consistent definition of what "revenue" or "ROAS" actually means across your tools.
What It Takes to Build a Reporting System
A reporting system is not more complicated than a dashboard. It is more deliberate.
Define your metrics precisely.
Contribution margin is not gross revenue. ROAS is not profit. CAC is not ad spend divided by orders. Every metric your business tracks needs a single, agreed definition that applies consistently across all sources.
Connect your sources once and maintain those connections.
This is usually a one-time setup per source. The ongoing cost is maintenance when APIs change or new sources are added.
Document your transformation logic and make it repeatable.
The rules for calculating your contribution margin; which costs are included, how returns are handled, how ad spend is attributed should be written down and applied the same way every time.
Schedule delivery so insight arrives without being requested.
Weekly report by Monday morning. Margin alert when a product drops below threshold. Monthly P&L ready on the first of each month. Delivery should be scheduled, not manual.
Dashboard or System: Which One Does Your Business Have?
Open your reporting setup and ask two questions.
First: if the person who built this left tomorrow, would it keep working next week? If the answer is no, you have a dashboard.
Second: if your Shopify, Meta Ads, and Google Ads data were all updated at midnight, would you see accurate combined metrics this morning without anyone doing anything? If the answer is no, you have a dashboard.
The goal of a reporting system is not to remove human judgment from analytics. It is to remove human effort from data assembly so that judgment can be applied to actual decisions.
How BizMetrics Approaches This
The first thing we establish with every client is which of the four layers is missing or broken.
Most brands have Layer 1 covered, their tools exist and capture data. Most have a version of Layer 4, someone is looking at numbers somewhere. The gaps are almost always in Layer 2 (integration is manual or missing) and Layer 3 (transformation is inconsistent or undocumented).
Fixing those two layers is what turns a collection of dashboards into a reporting system the business can depend on.
If your team is spending time assembling data instead of reading it, that is the problem worth solving first.
Need help with your analytics?
Let's structure your data into something you can actually use.
Start a conversation